Graphing Practice answers
Source of the answers http://hak8sciencefair.weebly.com/uploads/8/3/5/6/8356103/practice_analyzing_answers.pdf
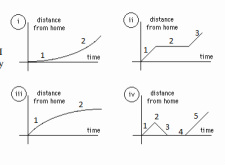
1. 1. Starts at home.
2. Walking.
3. Realizes they forgot their books.
4. Heads back home.
5. Gets the books.
6. Starts walking again.
2. 1. The person is driving.
2. A flat tire occurs.
3. Starts driving again.
3 (Graph 4).
1. Walks calmly.
2. Speeds up.
2. Walking.
3. Realizes they forgot their books.
4. Heads back home.
5. Gets the books.
6. Starts walking again.
2. 1. The person is driving.
2. A flat tire occurs.
3. Starts driving again.
3 (Graph 4).
1. Walks calmly.
2. Speeds up.
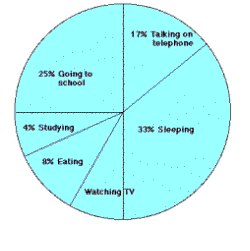
2. a. 13% are watching television.
b. 33% of the time they're sleeping.
c. Studying which is 4% of the time they're sleeping.
d. Going to school takes 25% of their day.
e. The two activites that take up half of their day is sleeping (33%) and talking on the telephone (17%).
f. The two activities that take up a quarter of the day is eating and talking on the telephone.
3
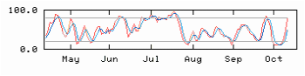
a. 8 sets of data is represented.
b. The graph begins in on May.
c The graph reaches its highest point in the month of March.
a. 8 sets of data is represented.
b. The graph begins in on May.
c The graph reaches its highest point in the month of March.
4.
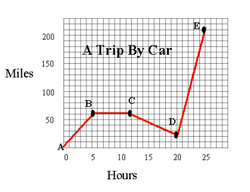
a. The car drove over 200 miles.
b. The cars average speed was 8 miles per hour.
c. Between 5 and 12 it goes from driving constant to going down.
d. The direction that is represented is that the mileage is beginning to go down.
e. The miles traveled in the first two hours may have been in the mid to high twenties
f. Line DE represented the fastest speed.
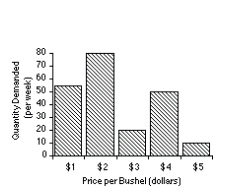
5
a. The dependent variable on the graph is the quantity demand per week.
b. Yes the bushel price does increase with each demand.
c. The demand when the bushel is 5 dollars is ten of them.
a. The dependent variable on the graph is the quantity demand per week.
b. Yes the bushel price does increase with each demand.
c. The demand when the bushel is 5 dollars is ten of them.
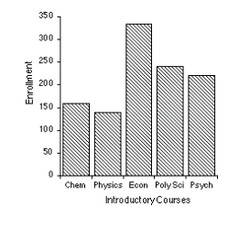
6
a. The total freshmen enrolled in college is 1,091.
b. I believe it would be 147%.
c. About 325 students are majoring in economics.
d. About 107 students are majoring in poly science than in physics.
a. The total freshmen enrolled in college is 1,091.
b. I believe it would be 147%.
c. About 325 students are majoring in economics.
d. About 107 students are majoring in poly science than in physics.
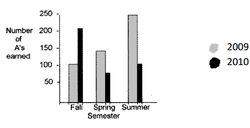
7
a. 282 A's were earned during the fall and spring of 09.
b. 132 A's were earned in the fall od 2010 then the spring of 2010.
c. The summer of 09 had the most A's earned.
d. The fall semester of 2010 had the most A's.
e The spring semester of 2010 had the fewest A's.
a. 282 A's were earned during the fall and spring of 09.
b. 132 A's were earned in the fall od 2010 then the spring of 2010.
c. The summer of 09 had the most A's earned.
d. The fall semester of 2010 had the most A's.
e The spring semester of 2010 had the fewest A's.
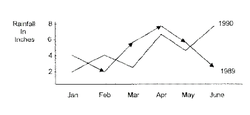
8
a. 3 inches of rain fell in March of 1989.
b. 2 inches more of rain fell in the Feburary of 1990 then in 1989.
c. June of 1990 had the most rainfall.
d. The wettest month was June of 1990.
a. 3 inches of rain fell in March of 1989.
b. 2 inches more of rain fell in the Feburary of 1990 then in 1989.
c. June of 1990 had the most rainfall.
d. The wettest month was June of 1990.
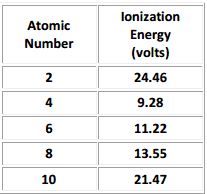
9.
a. The independent variable is the ionization of energy.
b. The dependent variable is the atomic number.
c. Their are 5 elements on the table.
d. Element has the highest ionization energy as a number of 21.47.
e. It would be in the shape of a roller coaster because it has its highs and its lows.
a. The independent variable is the ionization of energy.
b. The dependent variable is the atomic number.
c. Their are 5 elements on the table.
d. Element has the highest ionization energy as a number of 21.47.
e. It would be in the shape of a roller coaster because it has its highs and its lows.
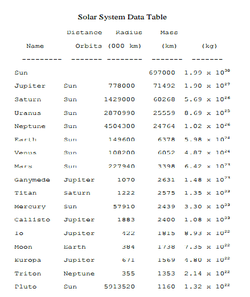
10.
a 8 planets are shown on the data table.
b 8 moons are shown on the data table.
c Ganymede has the largest mass weighing in at 2631.
d Venus has the closest radius to Earth.
e Seven moons are larger than plutos.
f Ganymede orbits closer to jupiter.
g Mars is the closest to earth.
a 8 planets are shown on the data table.
b 8 moons are shown on the data table.
c Ganymede has the largest mass weighing in at 2631.
d Venus has the closest radius to Earth.
e Seven moons are larger than plutos.
f Ganymede orbits closer to jupiter.
g Mars is the closest to earth.
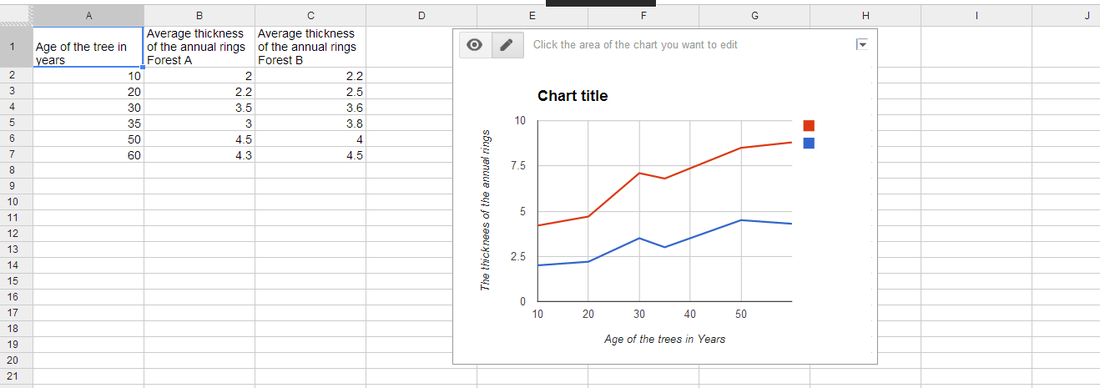
B.The dependent variable is the Age of the trees overtime.
C.The independent variable is the thickness of the annual rings.
D.
E.I can tell that Forest A is contains much more thicker annual rings than Forest B.
C.The independent variable is the thickness of the annual rings.
D.
E.I can tell that Forest A is contains much more thicker annual rings than Forest B.
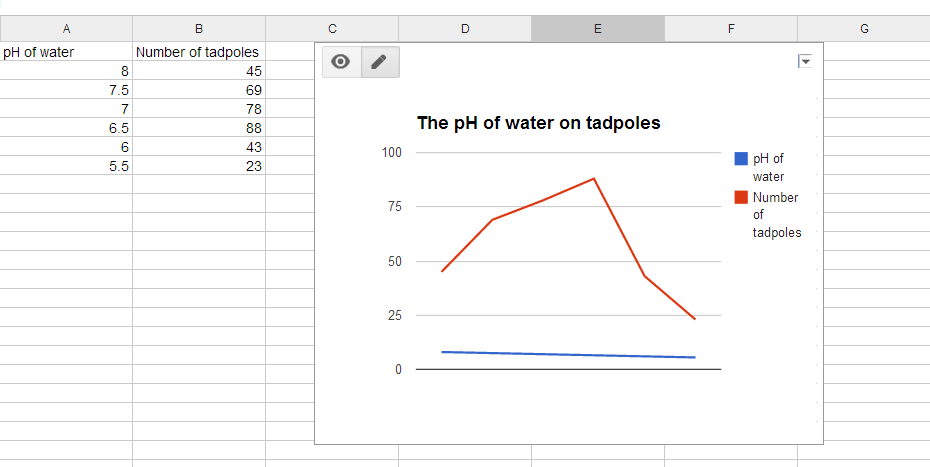
B. The dependent variable is the amount of tadpoles.
C. The independent variable is the pH of water.
E. The average tadpoles is 78 and 88
F. The optinum amount of pH water is probably 23
G. No
H. For 5 it would probably be 14
C. The independent variable is the pH of water.
E. The average tadpoles is 78 and 88
F. The optinum amount of pH water is probably 23
G. No
H. For 5 it would probably be 14
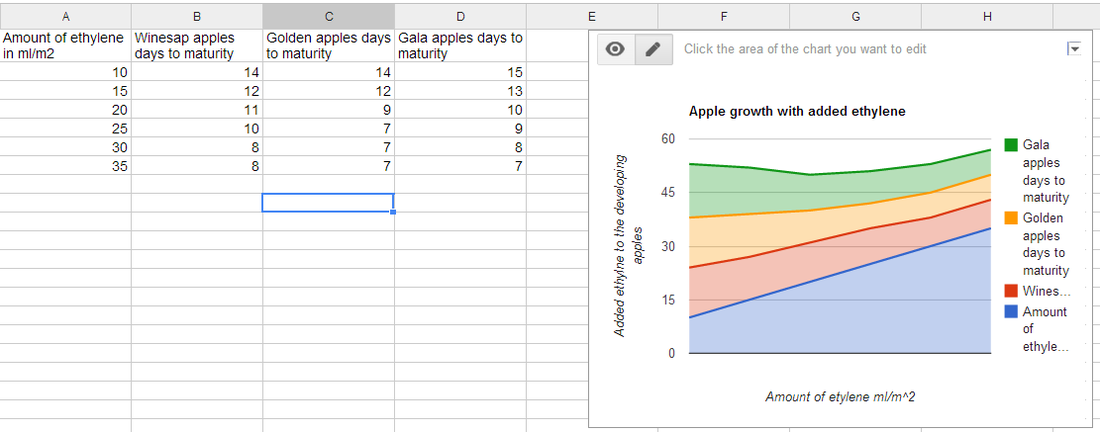
B. The dependent variable is the added ehylene.
C. The independent variable is the days overtime.
C. The independent variable is the days overtime.
